US Tornado Dashboard

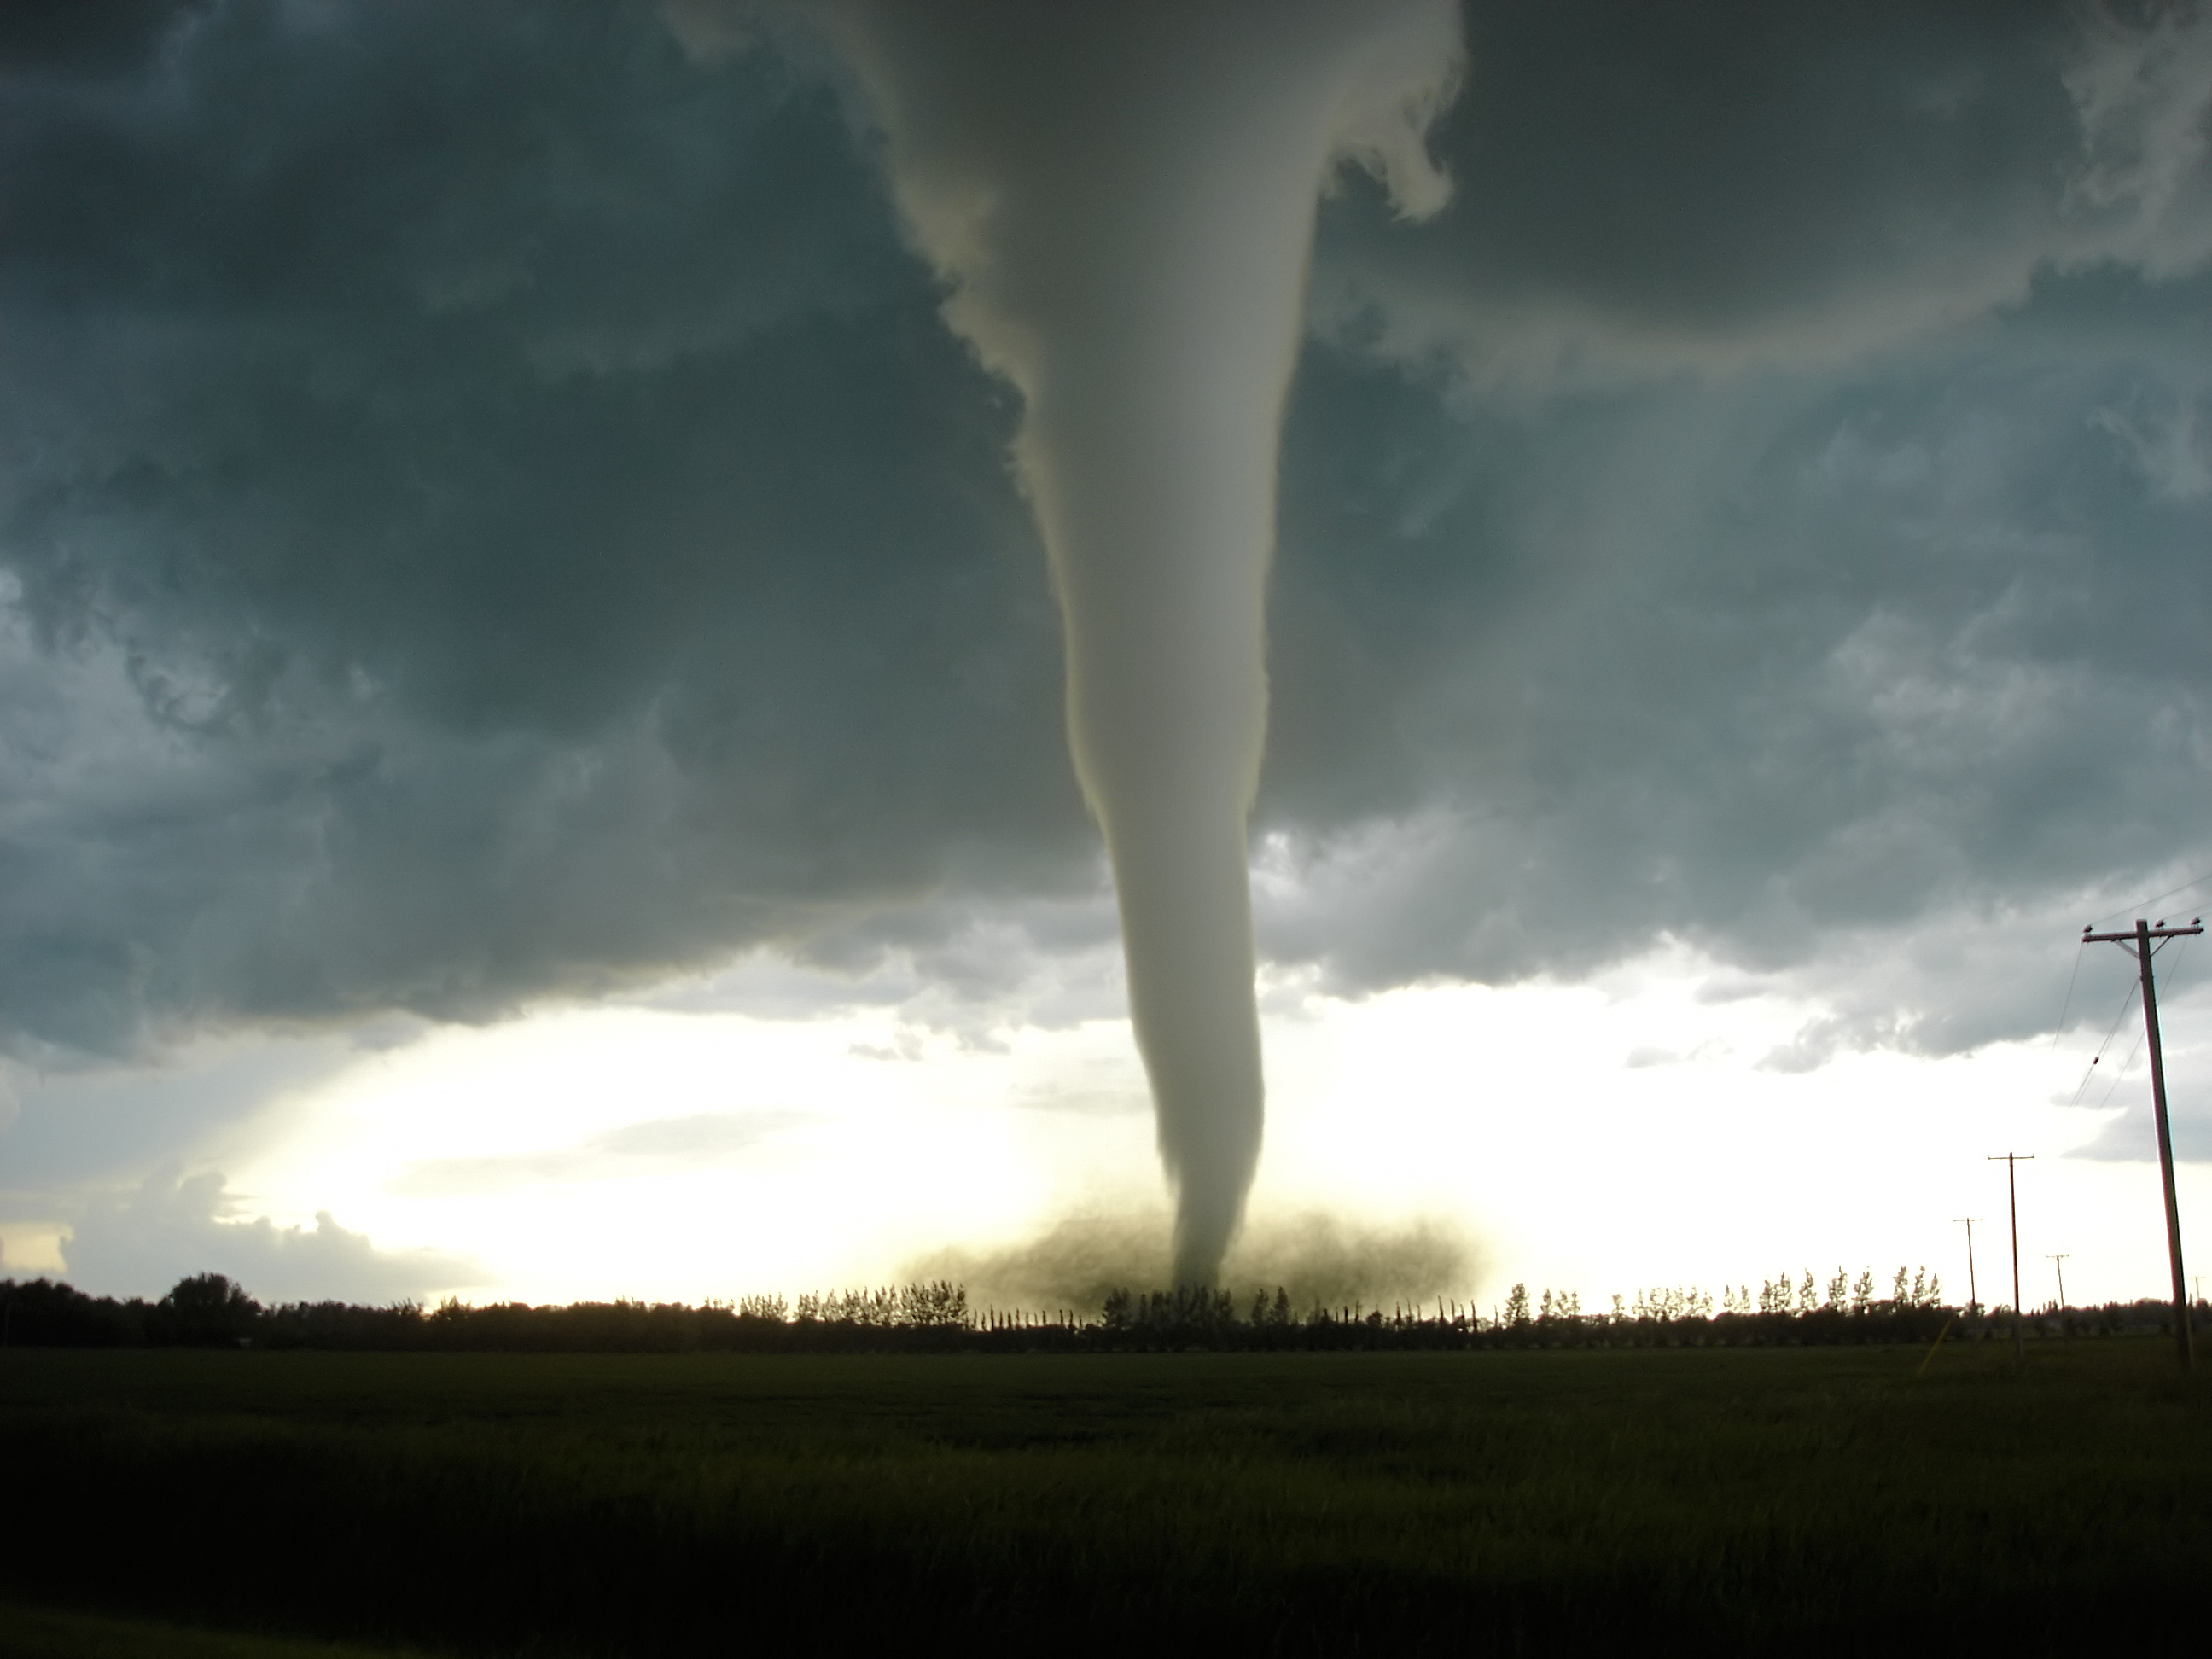
“File:F5 tornado Elie Manitoba 2007.jpg” by Justin Hobson (Justin1569 at English Wikipedia) is licensed under CC BY-SA 3.0.
Using Streamlit, Geopandas, and Plotly, I developed an interactive application to visualize US tornado data from 1950-2021.
This dashboard utilizes custom GeoJSON objects pertaining to US State and Territory boundaries to display 71 years of tornadoes, complete with filters for state and magnitude.
Summary statistics and aggregated visualizations show which states have experienced the worst tornadoes.
A secondary page provides comparisons between two states using statistical testing to compare which state has a higher average tornado rate, as well as within each state, a comparsion from before and after the year 2000.
Streamlit might take a while to boot, so I’ll include the feature chart below!
